MNbump + Facebook – March Analytics

It has been fun to watch the engagement rise on our MNbump Facebook page! I’m hoping that is an indication that you find our posts both helpful and enjoyable. Some might wonder ‘just how engaging is it’ and ‘how many people does this community Facebook page reach’ ??
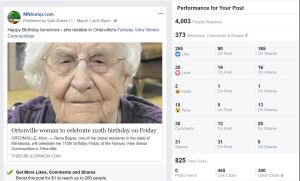
I’ll just share the actual analytic screenshots for clean review – with one small narrative as a lead-in: The first capture is the comparable – this is engagement over the last week and how MNbump compares to other sites that have a community or area focus with very similar ‘hopes’ to engage & provide information about their area – A couple notes… Otter Tail Lakes Country is pretty much always the #1 (and with greater numbers than reflected in today’s report) – Artie’s Bait – today’s number is the lowest I’ve seen it and that is likely because we are in between fishing seasons (hunting, etc.) – they are normally second or third on this report (between them and MNbump for the #2 & #3 spot!). So although this is a 7-day engagement snapshot (as of today), the order of things and numbers are generally within this range. Of course, there will be days that anyone of us has a very special post and there is a spike – and others that are much lower – this is a good reflection on a steady on-going view.
Let us know if you’re having an event that you’d like MNbump to cover – or if you have an idea on how your business or organization could collaborate with MNbump (we are a Big Stone Area Growth Initiative – click on this link to see who the MNbump bloggers are & what organizations have been instrumental in our MNbump creation!)
Below… and the % of up/down is gauged from the previous 7 day period – so again, that varies based on any given 7-day run.
All of the posts below were posted one time and were not “boosted”. Generally, the post reach for any given post as a “people reach” of 700 and up.
#MNbump life… Living Rural & Loving it!


